Data / FLFP
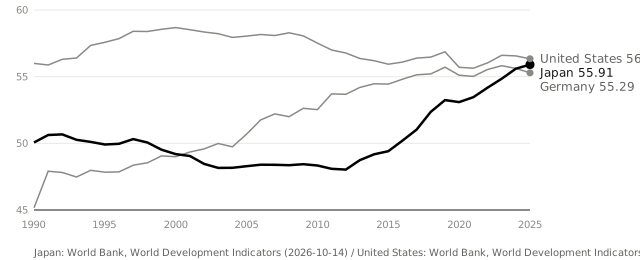
Labor force participation rate, female (% ages 15+, ILO est.)
女性の労働参加率
● Japan● United States● Germany
Japan 2025
55.91
United States 2025
56.34
Germany 2025
55.29
Sources and retrieval dates
- Japan
- World Bank, World Development Indicators ↗FLFP · Retrieved 2026-10-14
- United States
- World Bank, World Development Indicators ↗Retrieved 2026-10-14
- Germany
- World Bank, World Development Indicators ↗Retrieved 2026-10-14
- Unit
- %
Sources differ by country, so definitions may not match exactly even for the same year.
Values (excerpt)
YearJapan202555.91202455.6202354.85202254.17202153.46202053.09201953.24201852.37
All values(36)
202555.91202455.6202354.85202254.17202153.46202053.09201953.24201852.37201751.03201650.21201549.41201449.18201348.74201248.03201148.09201048.34200948.44200848.36200748.39200648.4200548.28200448.16200348.16200248.46200149.05200049.19199949.52199850.06199750.32199649.97199549.91199450.11199350.27199250.67199150.63199050.06