Data / POP65
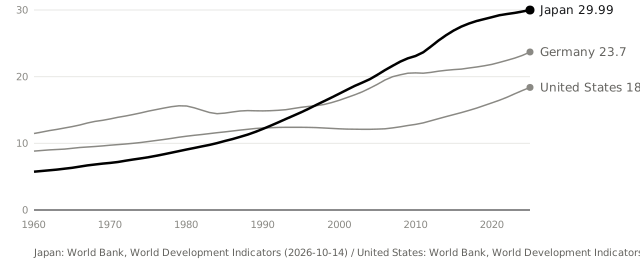
Population ages 65 and above (% of total)
65歳以上人口割合
● Japan● United States● Germany
Japan 2025
29.99
United States 2025
18.39
Germany 2025
23.7
Sources and retrieval dates
- Japan
- World Bank, World Development Indicators ↗POP65 · Retrieved 2026-10-14
- United States
- World Bank, World Development Indicators ↗Retrieved 2026-10-14
- Germany
- World Bank, World Development Indicators ↗Retrieved 2026-10-14
- Unit
- %
Sources differ by country, so definitions may not match exactly even for the same year.
Values (excerpt)
YearJapan202529.99202429.78202329.56202229.4202129.22202028.92201928.63201828.35
All values(66)
202529.99202429.78202329.56202229.4202129.22202028.92201928.63201828.35201727.98201627.51201526.92201426.23201325.41201224.51201123.65201023.1200922.76200822.25200721.63200620.98200520.28200419.62200319.09200218.6200118.03200017.44199916.87199816.32199715.76199615.2199514.66199414.15199313.65199213.15199112.64199012.16198911.71198811.31198710.96198610.64198510.35198410.0319839.7619829.5419819.319809.0719798.8419788.619778.3619768.1319757.9219747.7419737.5719727.3919717.219707.0619696.9519686.8319676.6919666.519656.3319646.1919636.0719625.9519615.8519605.74