Data / GDP_PC
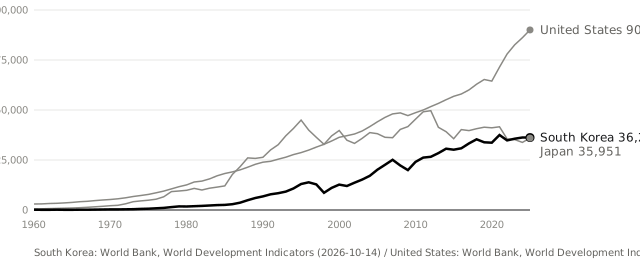
GDP per capita (current US$)
1人あたりGDP(名目・米ドル)
● South Korea● United States● Japan
South Korea 2025
36,227
United States 2025
90,027
Japan 2025
35,951
Sources and retrieval dates
- South Korea
- World Bank, World Development Indicators ↗GDP_PC · Retrieved 2026-10-14
- United States
- World Bank, World Development Indicators ↗Retrieved 2026-10-14
- Japan
- World Bank, World Development Indicators ↗Retrieved 2026-10-14
- Unit
- US$
Sources differ by country, so definitions may not match exactly even for the same year.
Values (excerpt)
YearSouth Korea202536,227202436,239202335,674202234,822202137,518202033,646201933,827201835,364
All values(66)
202536,227202436,239202335,674202234,822202137,518202033,646201933,827201835,364201733,297201630,832201530,172201430,667201328,449201226,601201126,175201024,071200919,937200822,252200725,078200622,610200520,167200417,122200315,212200213,643200111,981200012,710199911,06319988,583199712,822199613,865199513,002199410,73419939,18019928,38719917,87319906,81319895,98919884,88919873,65819862,91119852,54319842,46919832,24619822,03219811,91819801,74619791,81419781,42919771,0731976847.211975627.141974572.491973412.51972328.021971304.271970281.791969245.491968199.981967162.461966134.431965109.431964124.241963147.011962106.62196194.21960158.84